 by
by In the volatile world of crypto trading, Jacob, an aspiring trader, once boasted about a promising trade based on a chart he’d analyzed. Little did he know, his interpretation was skewed due to an incorrect number of candles on his chart, leading him to miss out on a significant profit opportunity. This anecdote underscores the critical importance of charting in crypto trading. Candlestick charting, in particular, has become the go-to method for many traders, offering visual insights into price movements and potential future trends. However, one of the often-overlooked aspects is choosing the right number of candles for accurate analysis. It’s not just about seeing the patterns; it’s about understanding the story they tell.
Understanding Candlestick Charting
History and Origin
Candlestick charting can trace its roots back to 17th-century Japan. Initially used by rice traders to predict price movements, these charts provided a visual representation of supply and demand forces. Honma, a legendary rice trader, was said to have used this technique, amassing a great fortune. As time progressed, the West took notice. By the 20th century, with the globalization of financial markets, the traditional Japanese method had been adapted and integrated into modern trading strategies, proving its timeless relevance.
Components of a Candlestick
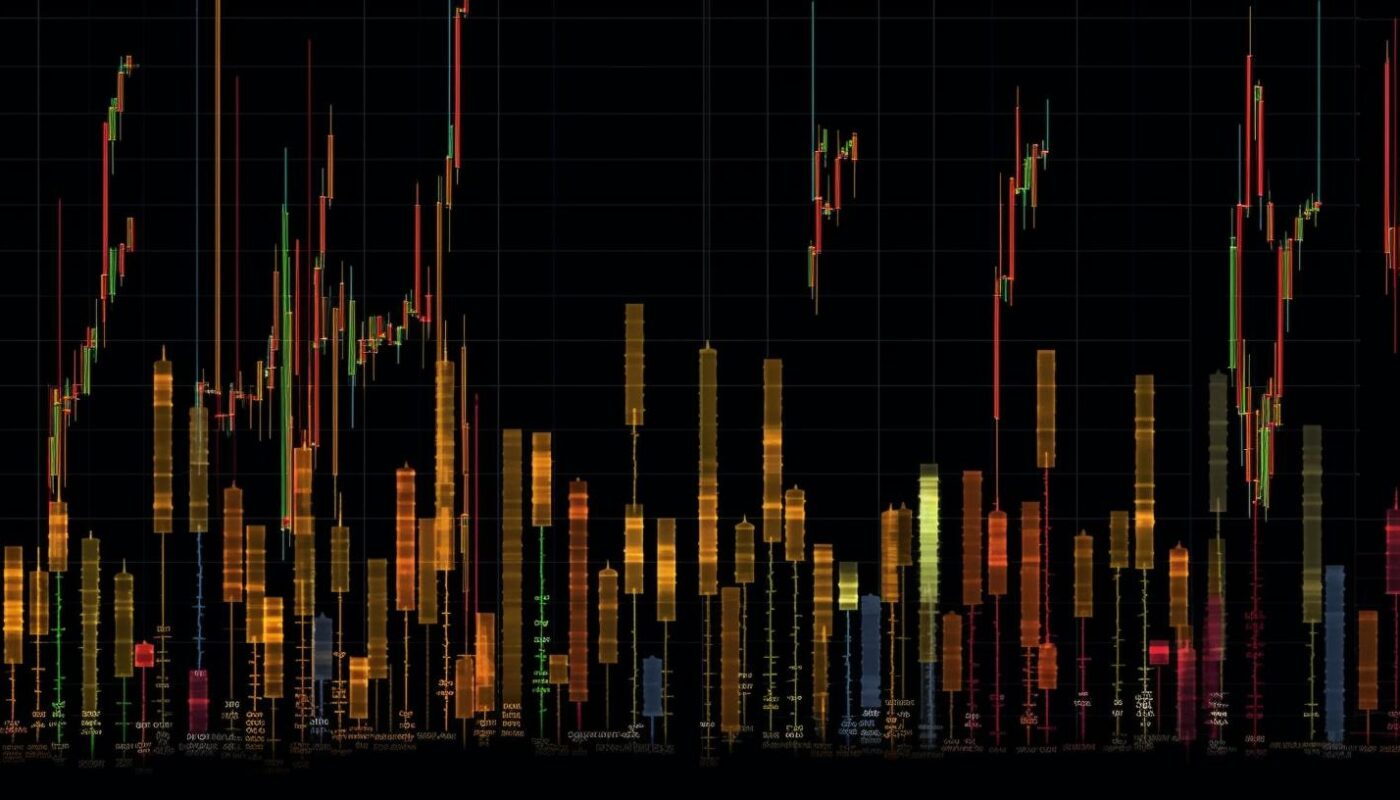
At its core, a candlestick captures four key price points: the opening, closing, highest, and lowest prices within a given timeframe. Visually, this is represented by a box (the body) and thin lines (wicks or shadows) extending from it.
A bullish candle is typically represented in green or white, indicating that the closing price was higher than the opening price. Conversely, a bearish candle, often in red or black, shows that the asset closed at a lower price than it opened. These color distinctions provide traders with quick insights into market sentiment for that period.
Factors Influencing the Number of Candles
Trading Time Frame
In the dynamic world of crypto trading, the time frame you operate in can drastically affect the number of candles you consider. For short-term traders, or intraday traders, the emphasis is on minute-by-minute or hourly price movements. Such traders might use charts with a smaller number of candles, focusing on a few hours or a day at most. On the flip side, long-term traders, often known as swing or position traders, look at more extended periods, such as weeks or months. For these traders, a chart may have a significantly larger number of candles, reflecting the longer time frame under analysis.
Volatility of the Asset
Crypto assets can be broadly classified into two types based on their volatility: volatile and stable. Volatile assets, like Bitcoin, often experience rapid and significant price changes within short time frames. For these assets, a denser collection of candles might be beneficial to capture the frequent price shifts. On the contrary, more stable assets, or “stablecoins” like Tether (USDT), exhibit minor fluctuations. When analyzing such assets, traders might opt for fewer candles, focusing instead on broader trends over extended periods.
For instance, when analyzing a volatile altcoin that recently entered the market, you might see extreme price swings over a week. In this case, a daily candlestick chart might be too broad, and you’d benefit from hourly or even 15-minute candles. Conversely, for a well-established asset with consistent behavior, like Ethereum, a daily or weekly candlestick chart might suffice.
Choosing the Perfect Number of Candles
Establishing a Baseline
One of the foundational steps in chart analysis is establishing a baseline, which often involves delving into historical data. By examining past price movements, traders can gain a clearer understanding of an asset’s behavior and its potential future trajectory. This doesn’t mean predicting the future based on the past, but rather identifying patterns and tendencies that recur over time.
For those new to charting or for a quick general overview, a good starting point is to choose a default number of candles that captures a broad range. For instance, a 30-day chart with daily candles provides a month-long snapshot of an asset’s activity, offering a balanced view of both short-term fluctuations and longer-term trends.
Adjusting for Personal Strategy
No two traders are alike, and the perfect chart for one might be cluttered or inadequate for another. This is where personal strategy comes into play. If you’re a risk-averse trader, you might prefer more candles to capture finer details, whereas a risk-tolerant trader might opt for broader strokes to spot significant moves.
It’s crucial, however, to remember that the market, your knowledge, and your strategy will evolve over time. As such, the number of candles you initially deem perfect might not remain so. Regularly reviewing and adjusting your chart configuration ensures it remains aligned with your trading objectives.
Adaptability is key in the dynamic world of crypto trading. By continually refining your approach, staying flexible, and adjusting to the ever-changing market conditions, you enhance your chances of trading success.
Common Mistakes and How to Avoid Them
Overloading the Chart
We all want to be thorough, but in the realm of crypto charting, more isn’t always better. Take the example of Sarah, an enthusiastic newbie trader. Eager to miss no detail, she loaded her chart with an extensive array of hourly candles spanning months. The result? A cluttered, indecipherable mess that obscured more than it revealed. Sarah’s mistake highlights the pitfalls of having too many candles.
Charting is as much about clarity as it is about detail. It’s essential to strike a balance. While it’s tempting to capture every market movement, doing so can lead to “analysis paralysis.” The key is to decide on your trading horizon and choose a candle count that offers a clear yet comprehensive view of that period.
Being Inconsistent
James, a trader with a penchant for tinkering, changed the number of candles on his chart every other day, chasing the ‘perfect’ setup. This erratic behavior, however, left him confused and often caused him to second-guess his decisions. The frequent shifts in perspective prevented him from getting a consistent read on market movements. James’s experience underscores the dangers of inconsistency.
When you’ve chosen a number of candles that aligns with your trading strategy, it’s prudent to stick with it for a set period. Consistency provides a steady lens through which to view the market, allowing patterns and trends to emerge more clearly. If you feel the need for change, do so with consideration, and avoid hasty, frequent modifications.
Conclusion
Choosing the right number of candles isn’t just a trivial detail—it’s pivotal for making informed trading decisions in the intricate dance of the crypto market. As you embark on your journey towards candlestick mastery, remember that there’s no one-size-fits-all answer. The best traders don’t just adopt strategies; they adapt them. So, take the insights from this article, experiment, refine, and continually learn. Your path to more accurate and strategic trading awaits. Harness the power of the candle, and let it illuminate your trading endeavors!
FAQs
Why is the number of candles so crucial in charting?
The number of candles determines the time frame and granularity of your analysis, influencing charting accuracy and trading strategy effectiveness.
How often should I reevaluate my chosen number of candles?
Reevaluation is advisable whenever there’s a significant change in your trading strategy or market conditions. However, consistency is also key to clear analysis.
Can I use the same number of candles for different crypto assets?
While possible, it’s essential to consider asset diversity and individual volatility. Each asset’s behavior might necessitate a different charting approach.
What tools or software can help in determining the ideal number of candles?
Several crypto trading tools and platforms offer customizable charting features, including TradingView, Binance, and MetaTrader. They assist in optimizing your candle configuration.